0–15
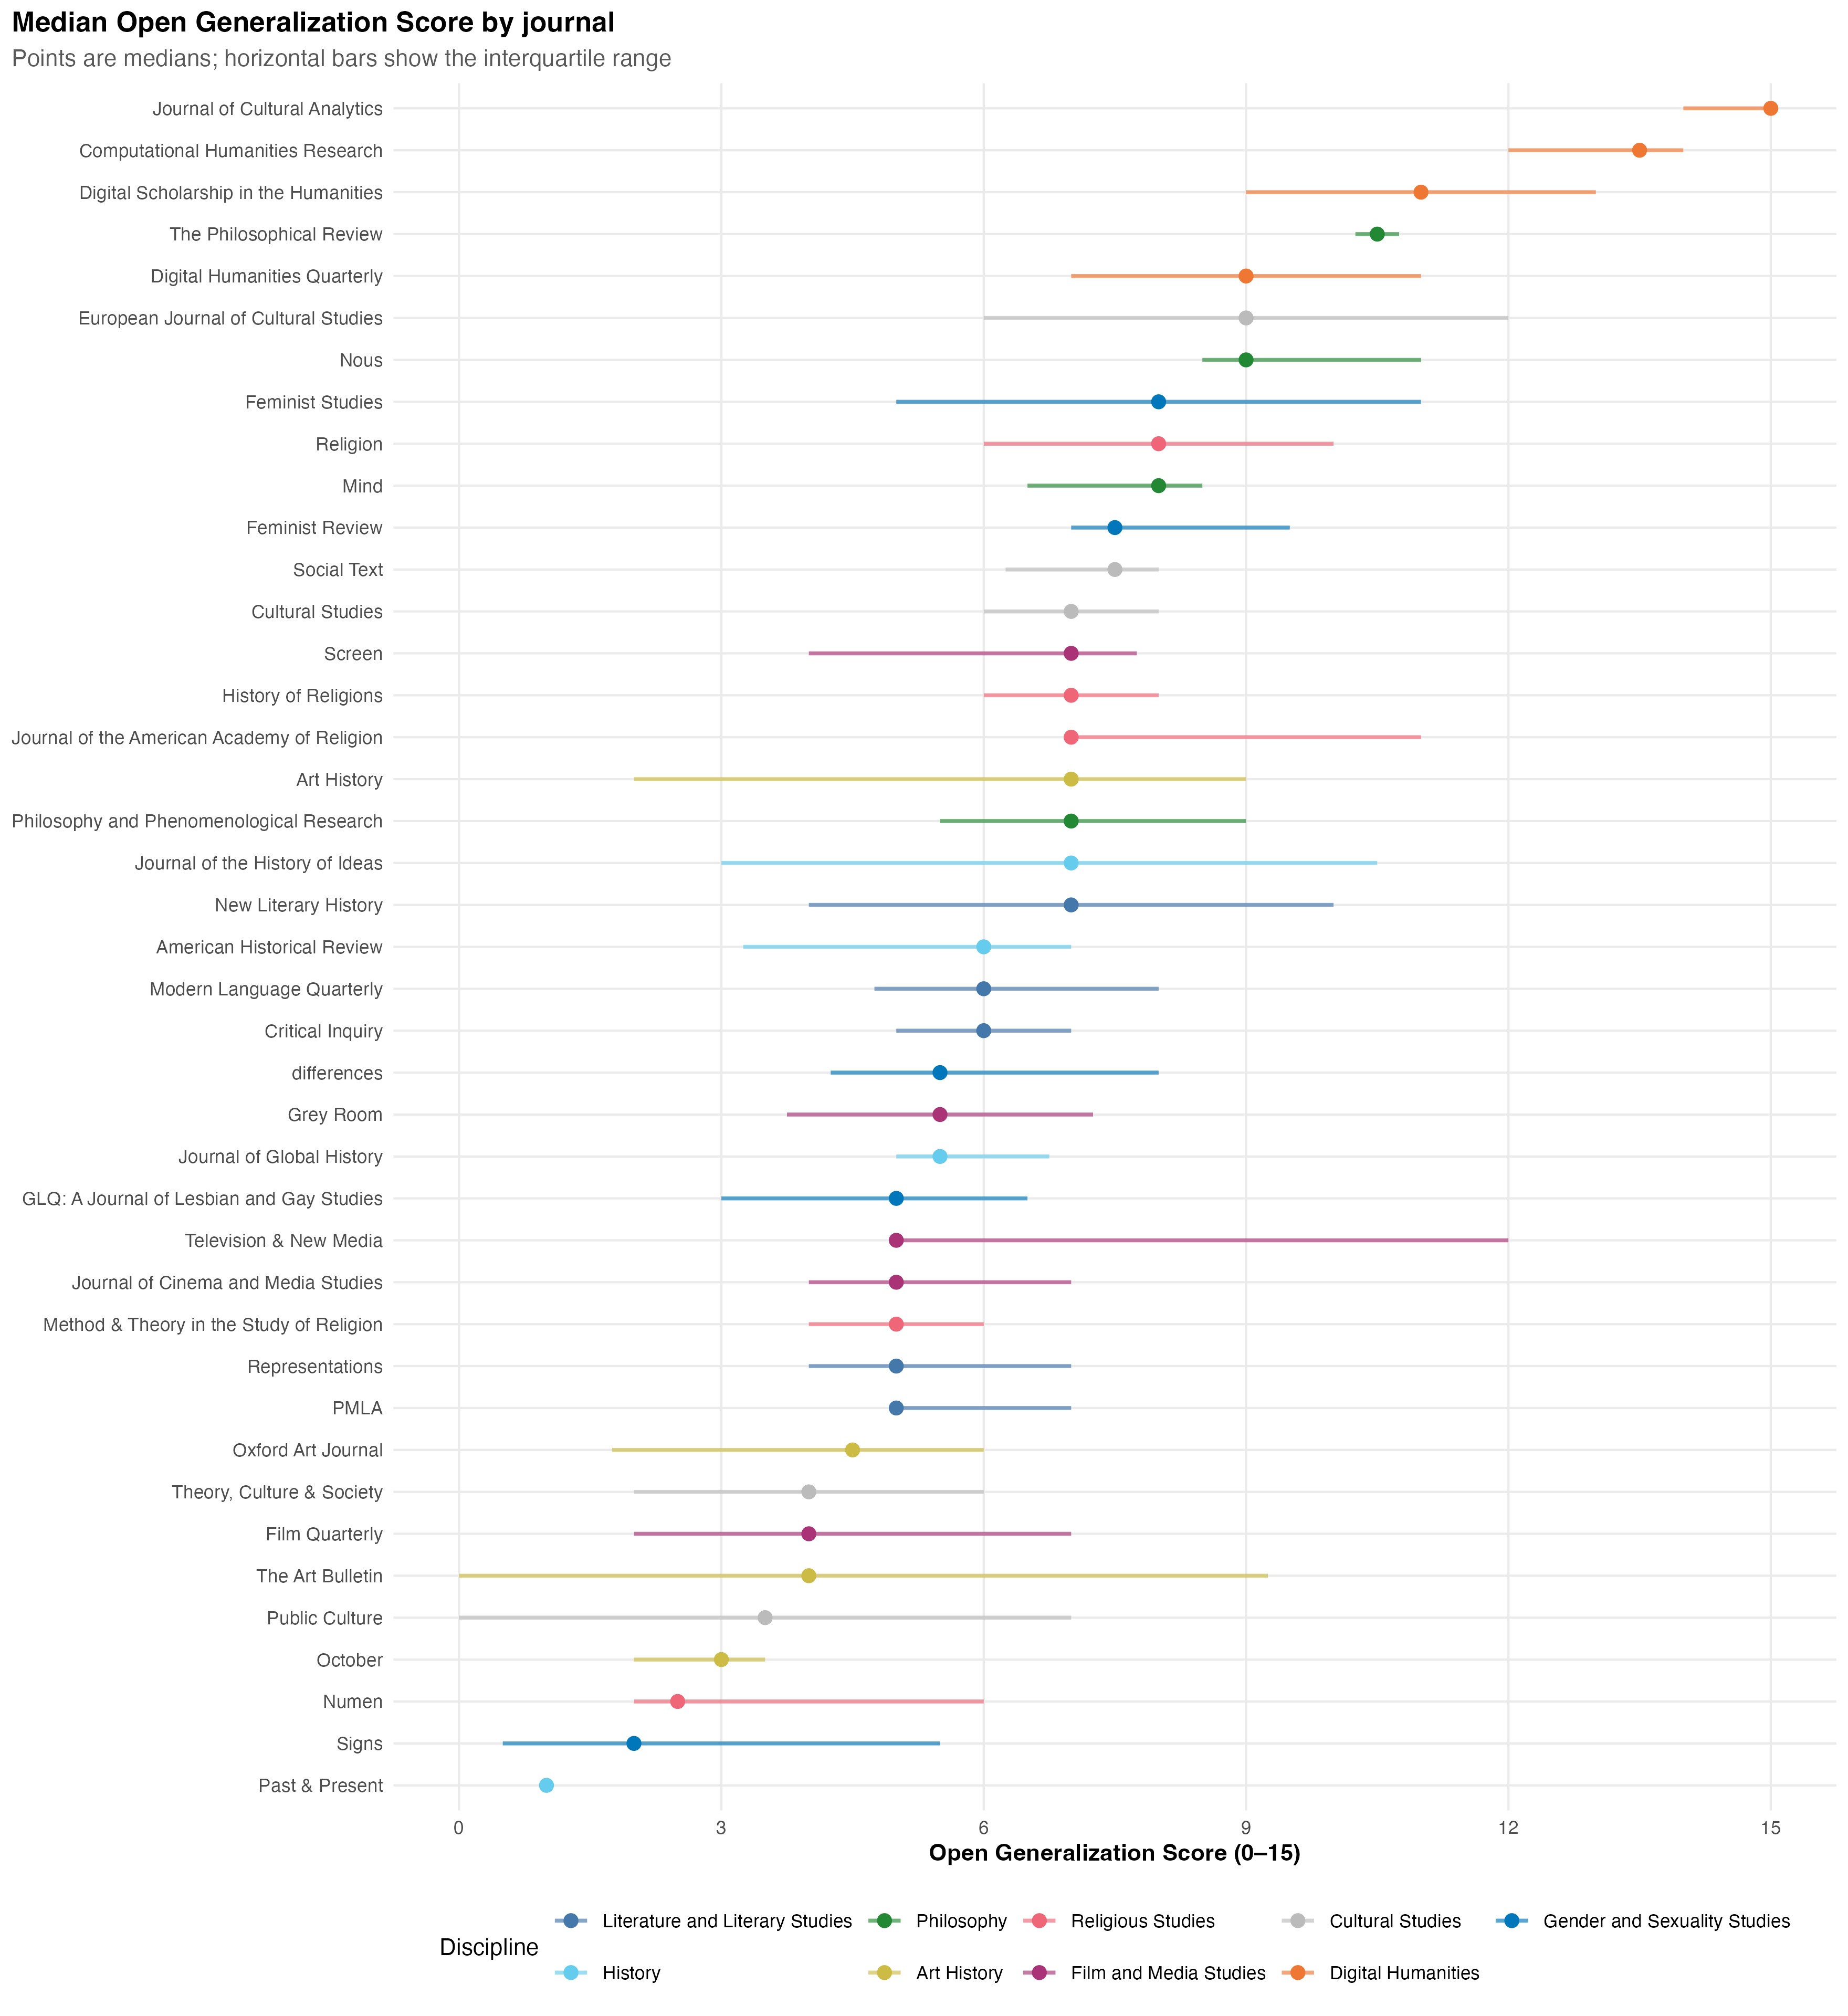
Open Generalization Score
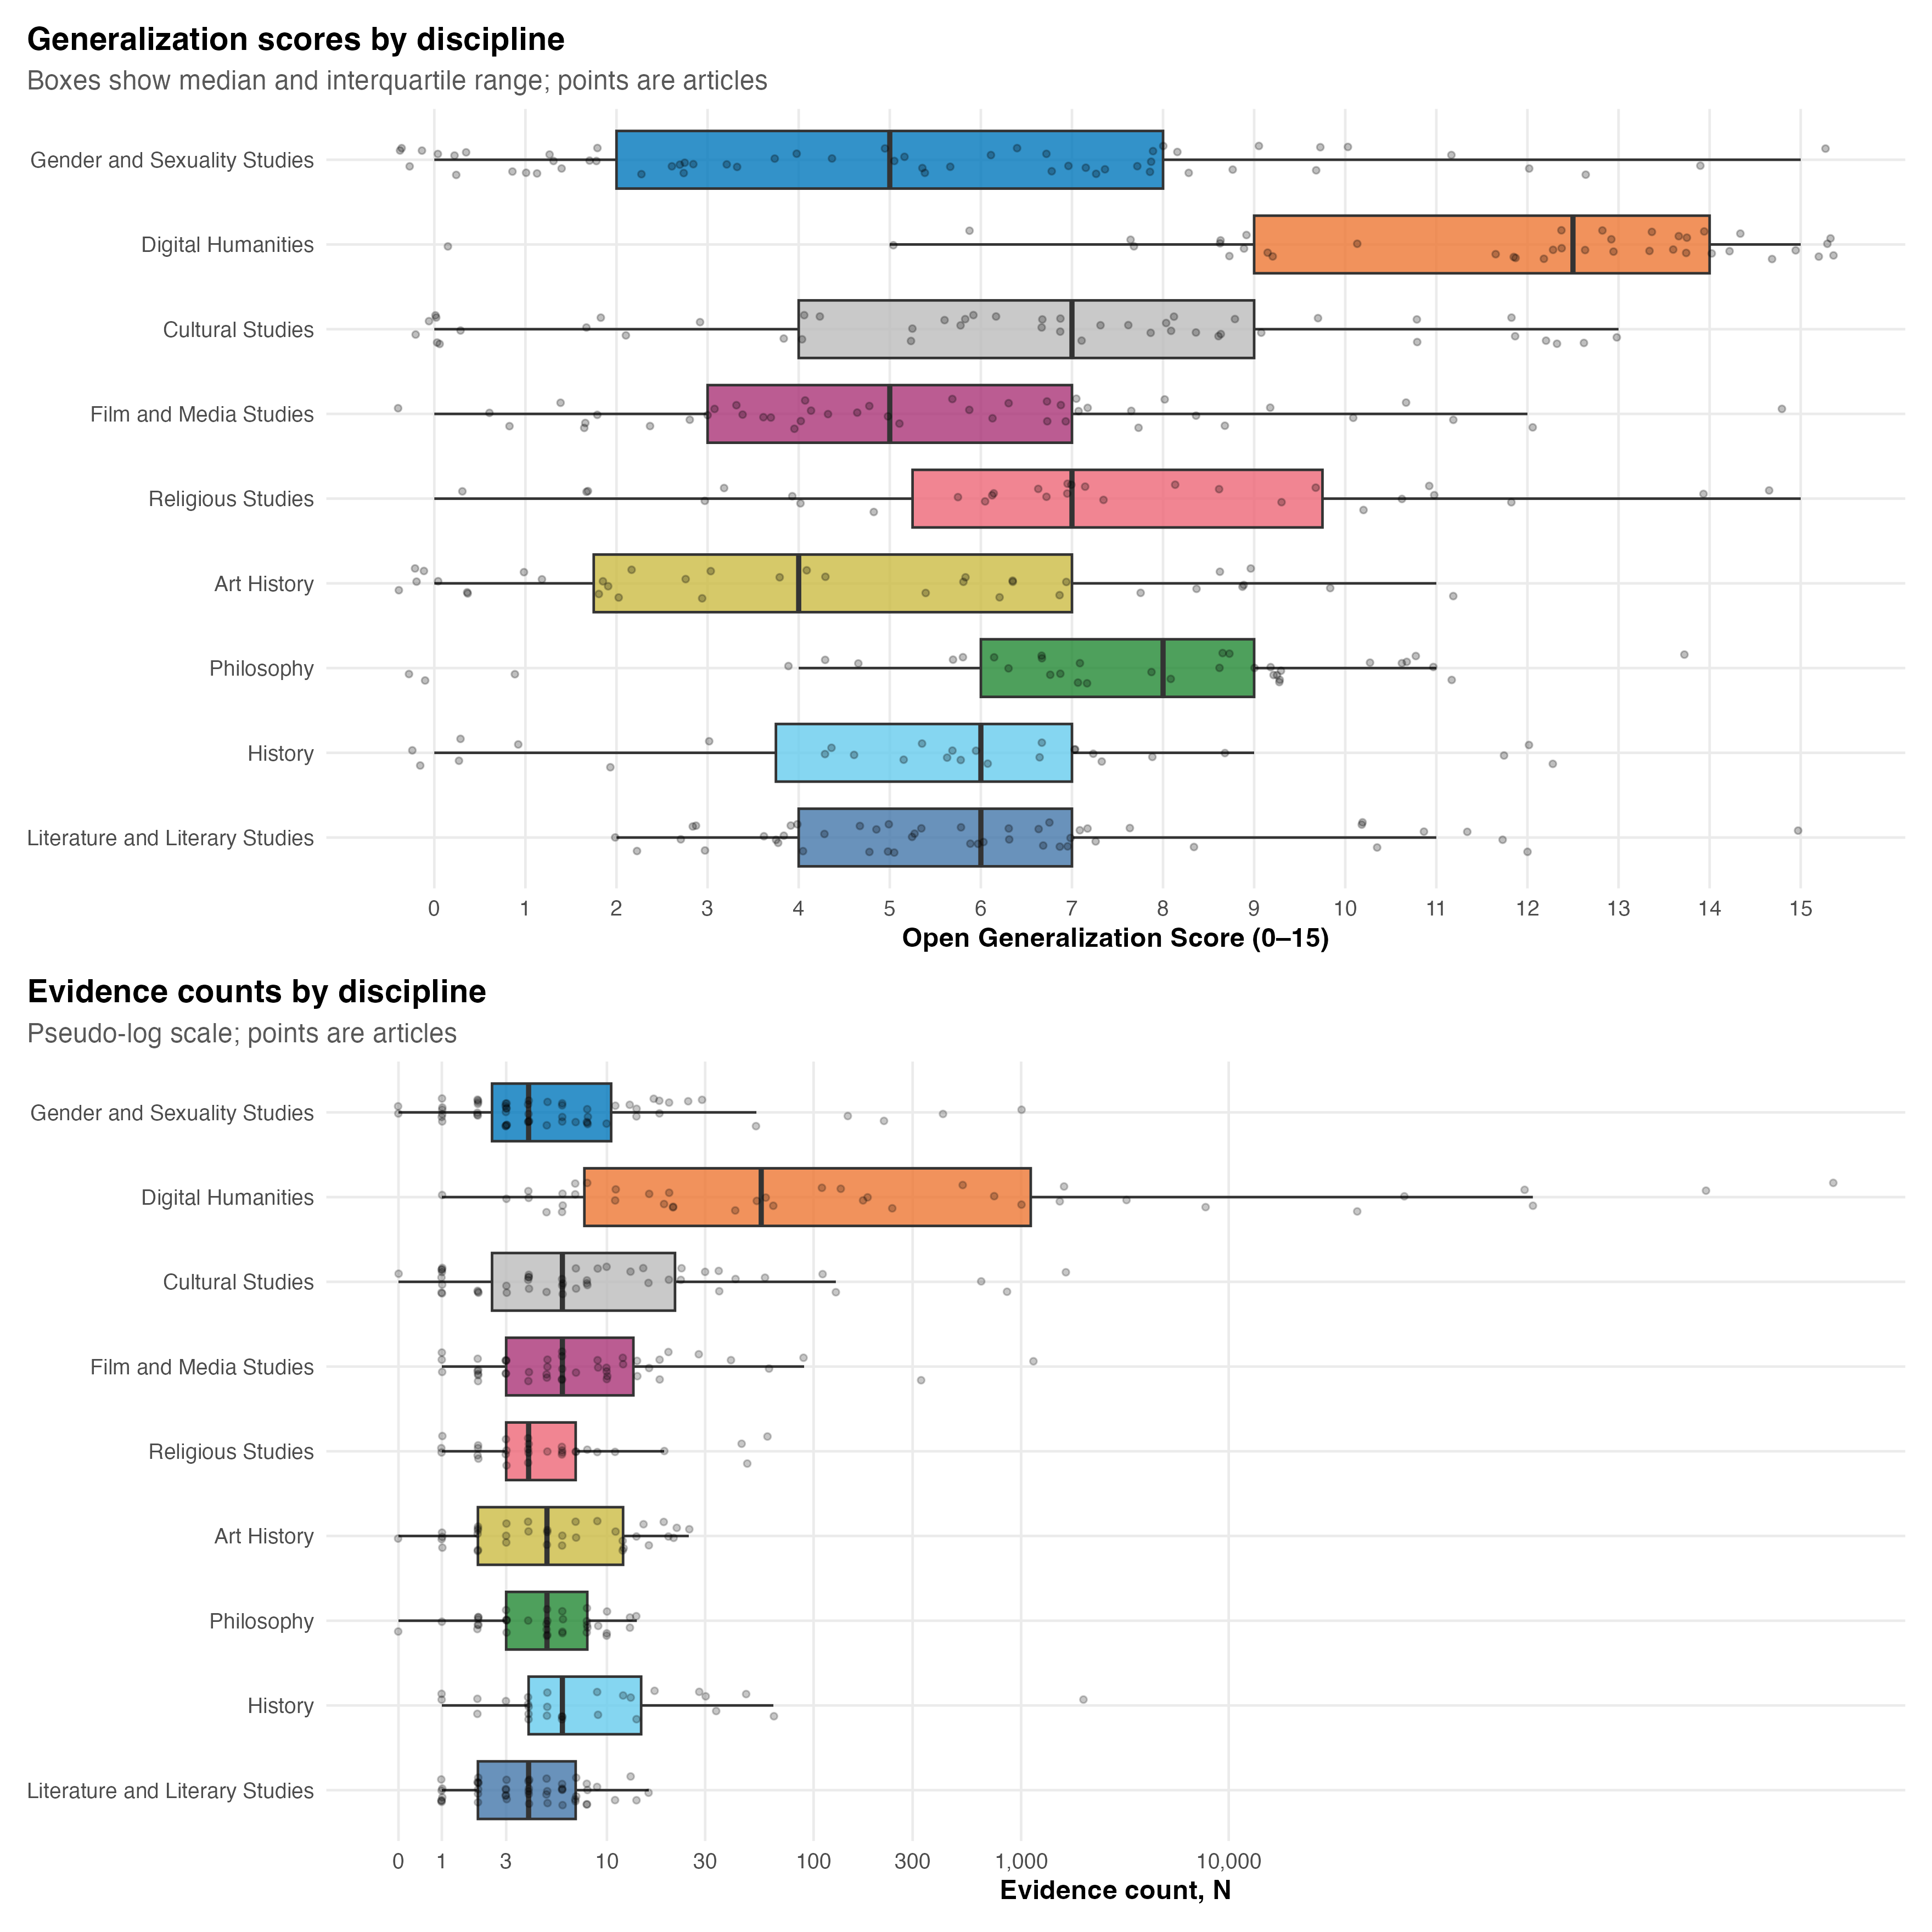
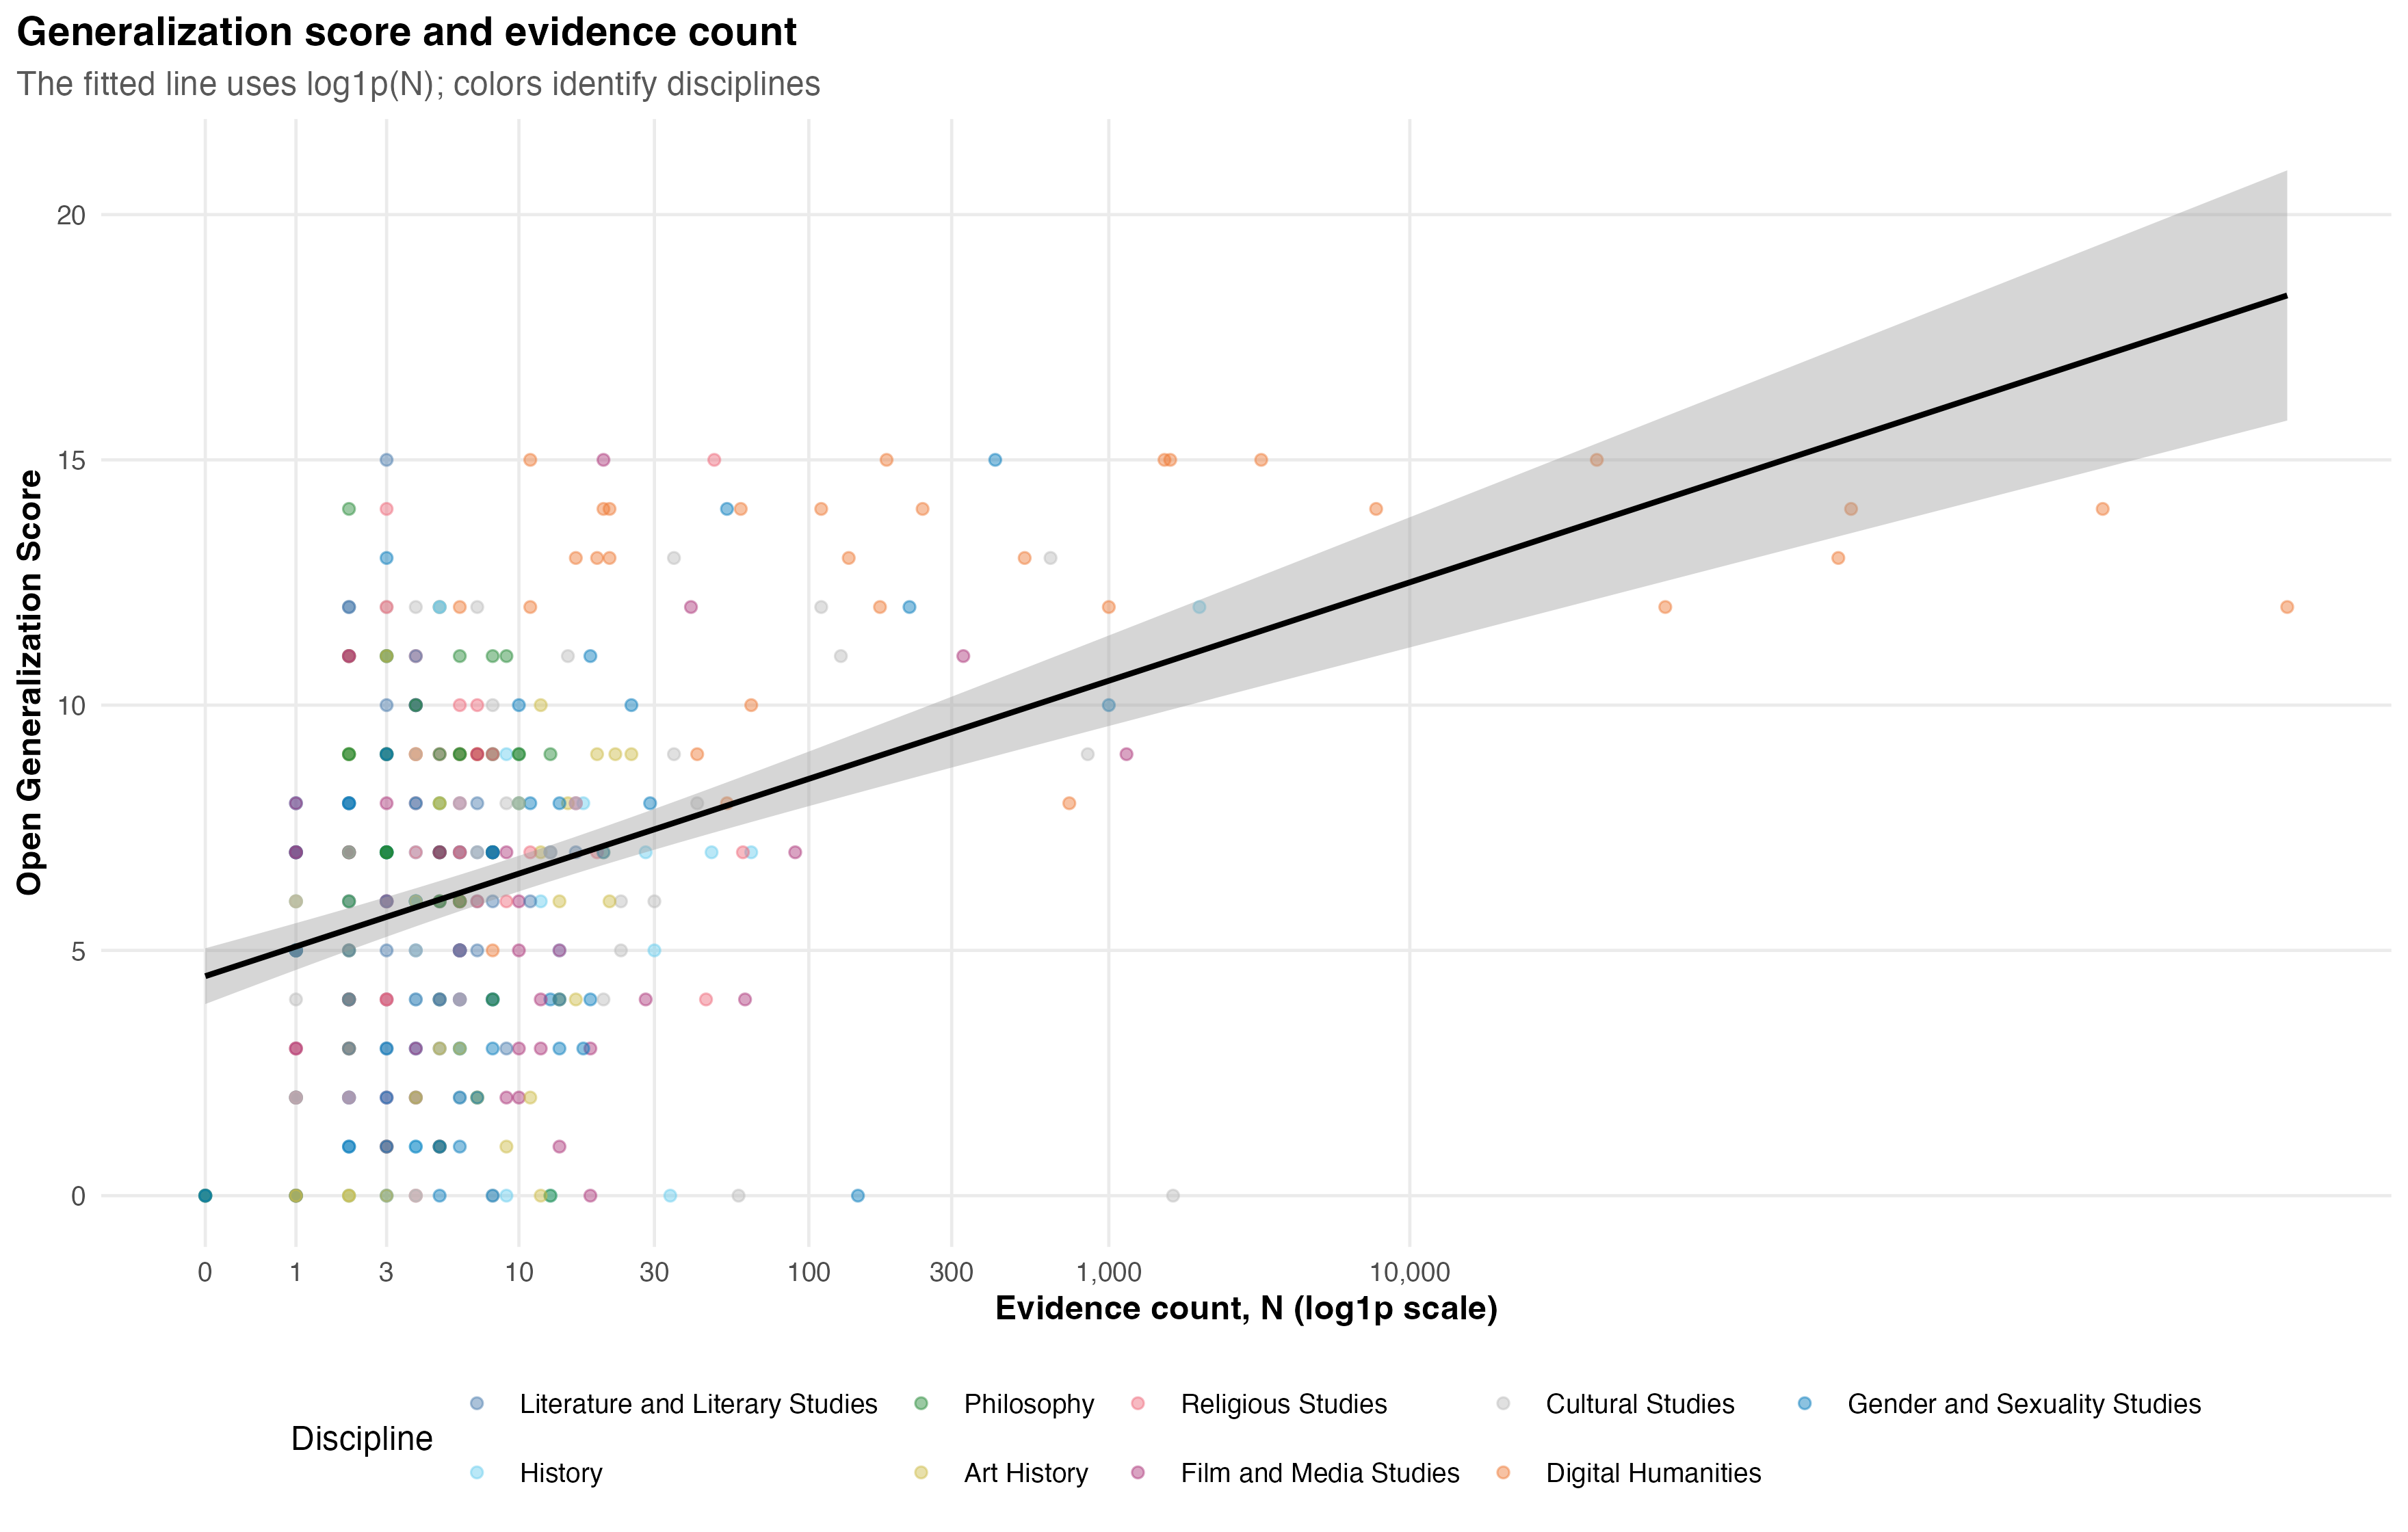
The sum of three 0–5 assessments: evidence transparency, analytical transparency, and limitations transparency.
The Open Generalization Framework
Inspector General offers a systematic view of the relationship between research claims and evidence across leading humanities journals.
Introduction
This project is an extension of the book Can We Be Wrong? The Problem of Textual Evidence in a Time of Data (Cambridge 2020). It asks how we can make cultural and historical interpretation more credible and align humanistic methods with cross-disciplinary frameworks of evidentiary evaluation. Rather than consider two different evaluation frameworks for the humanities and the sciences — or the humanities and computational humanities — the book argues that both should be subject to the same criteria, which I call the Open Generalization Framework.
Framework
The framework is built around three core principles:
Clearly state how many units are analyzed and discuss how representative those units are of the broader population from which they are drawn.
Clearly state how the evidence will be analyzed, including the methods used, what dimensions are examined, and how units are selected and interpreted.
Discuss material limitations of the claims, methods, or evidence. The strongest accounts incorporate those limitations into the claims made rather than merely mentioning them.
Methods
Start with leading journals grouped into nine humanities disciplines and select each journal’s final 2025 issue.
Uses GPT-5.6 to label the article's central claims, evidence, and transparency surrounding the evidence and its relationship to the claims made.
Classify the reports and use a documented R workflow to compare journals, disciplines, evidence counts, and generalization scores.
Measures
Check out the full workflow for further measures of the types of research claims (classes such as concepts, behavior, technology, etc.) and scales of research claims (both spatial and temporal, e.g. decades, centuries, cities, nations, the world).
The sum of three 0–5 assessments: evidence transparency, analytical transparency, and limitations transparency.
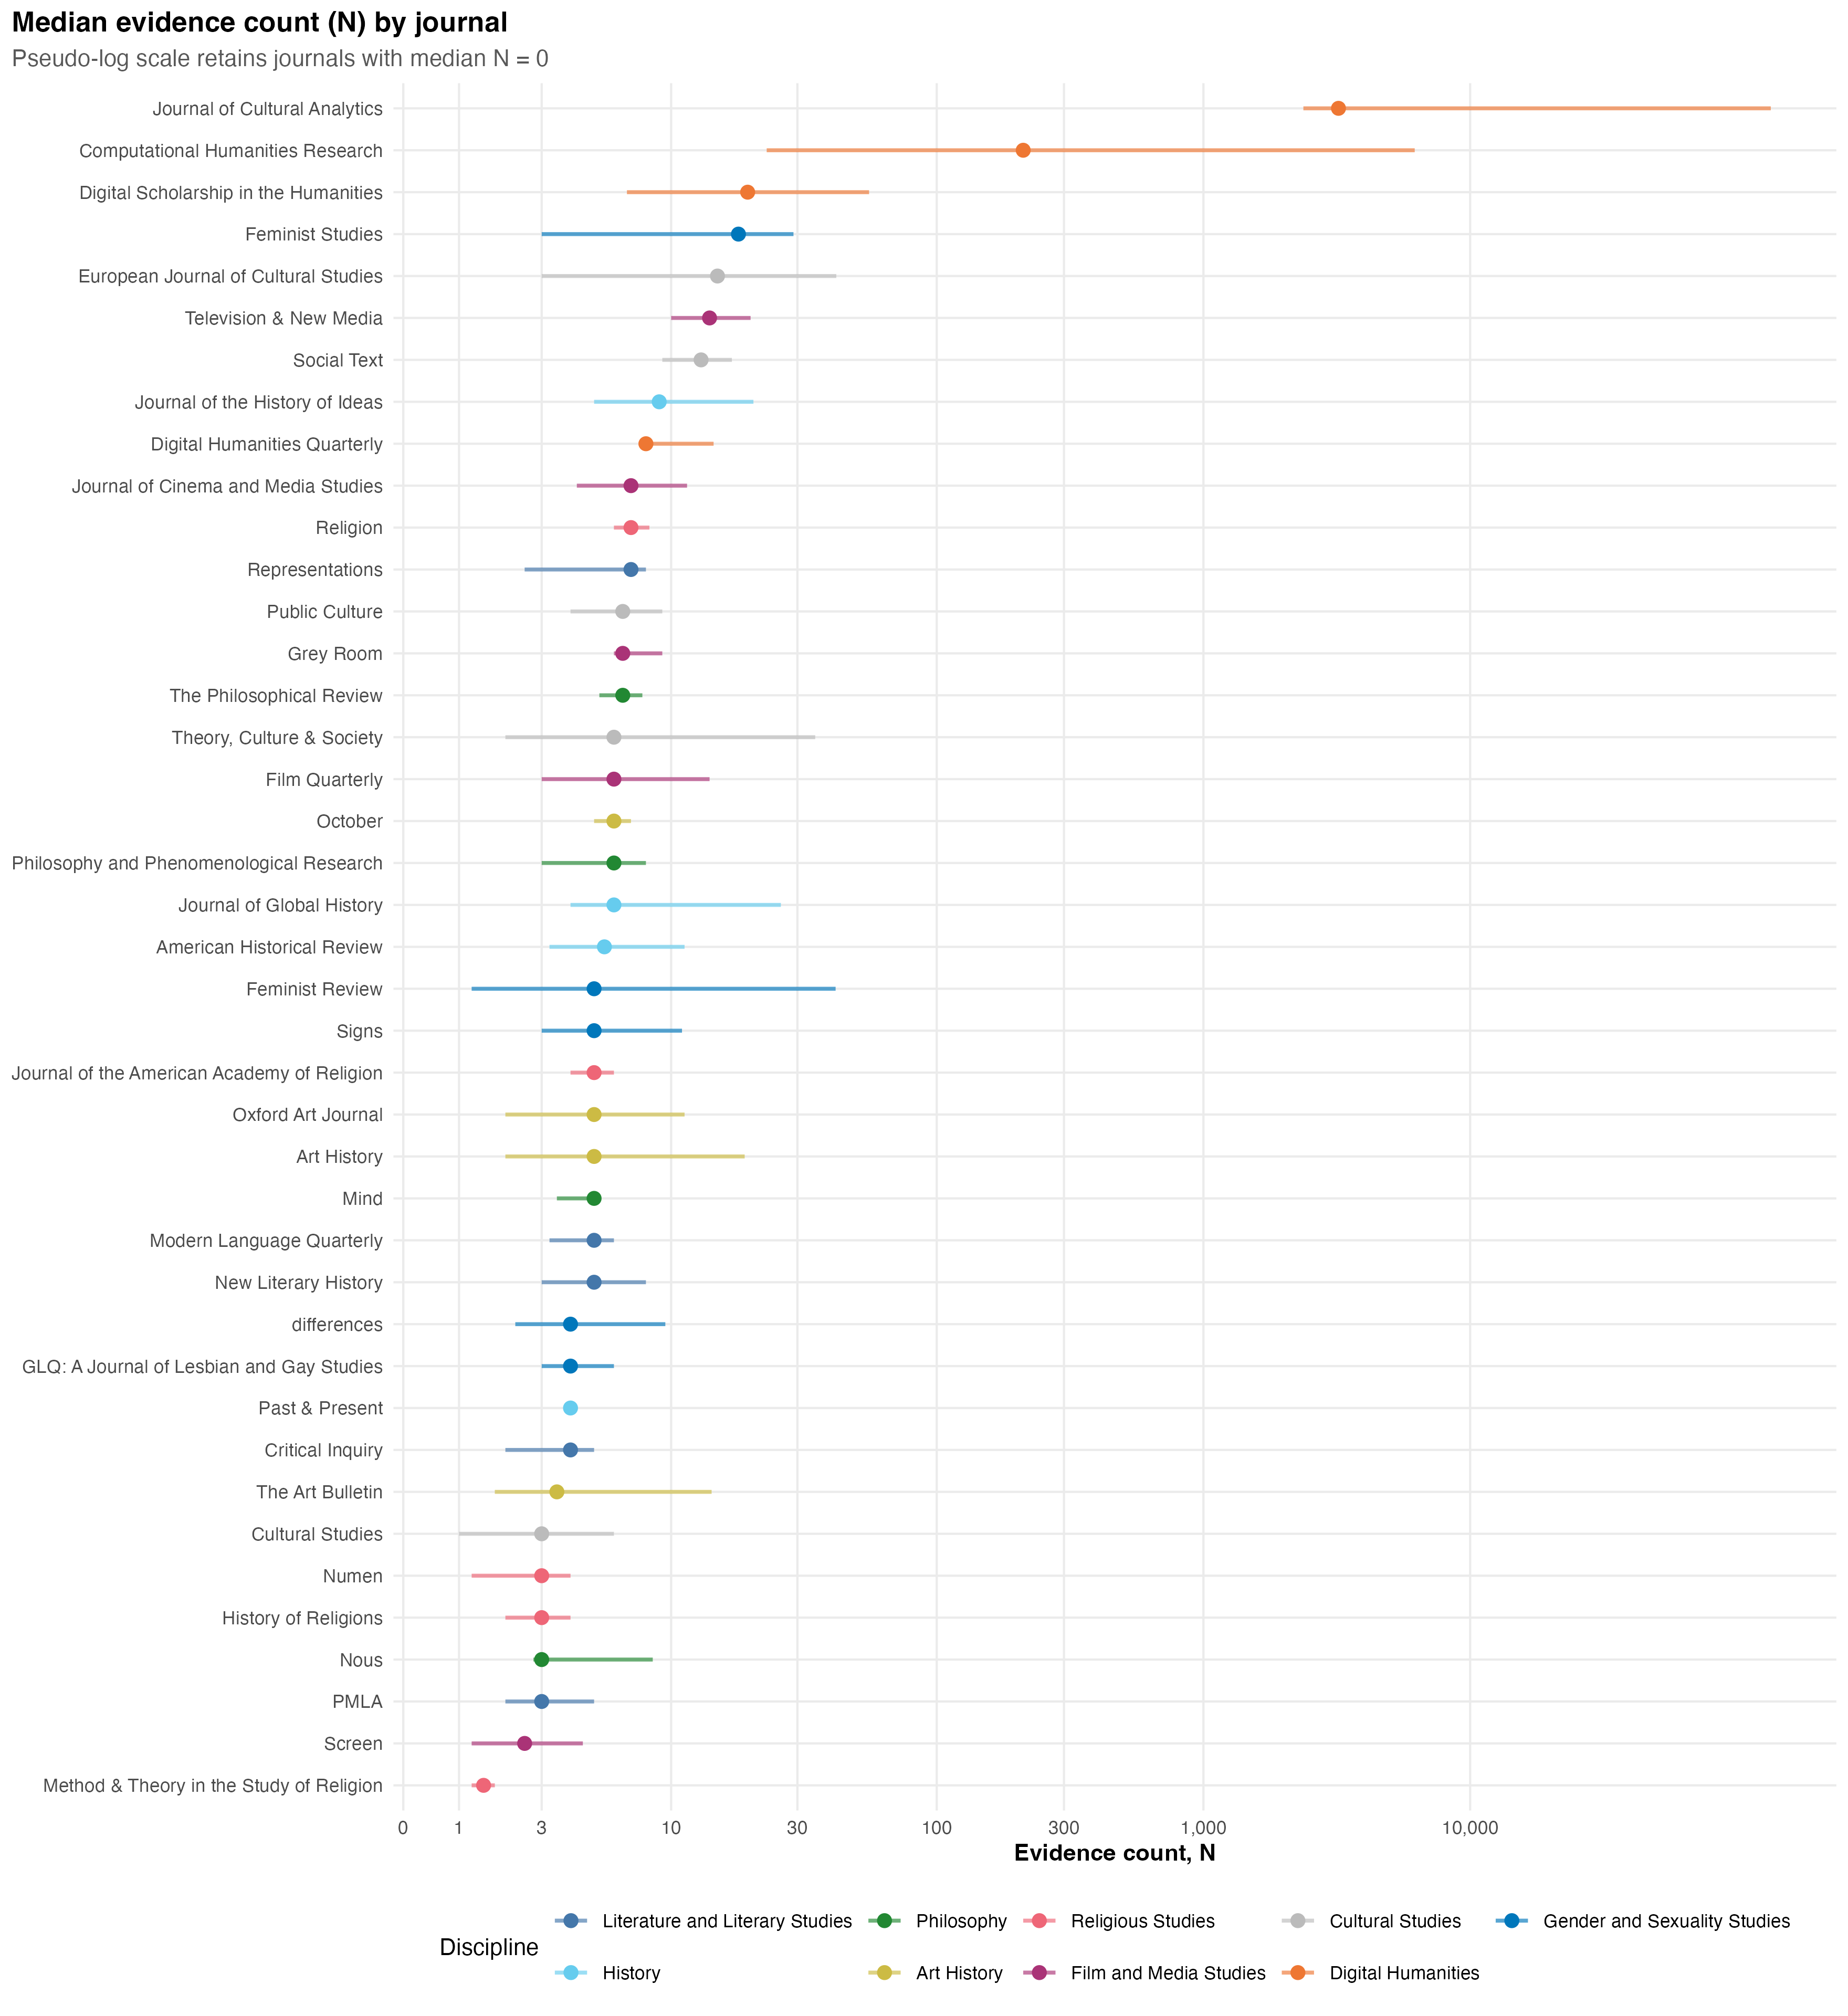
The non-duplicated count of explicit or identifiable evidence units used to support the central generalizable claim.
Selected results
The figures below are generated by the repository’s documented R workflow. Click any figure to inspect it at full resolution.
Open methods
The repository contains the article-harvesting workflow, structured diagnostic schema, classification step, discipline crosswalk, statistical models, and figure-generating R code.
Explore Inspector General on GitHub